Case Study -
Winning new customers: the home energy transformationThe energy sector was going through major changes, and strategic teams needed to understand the new landscape to make informed business decisions.
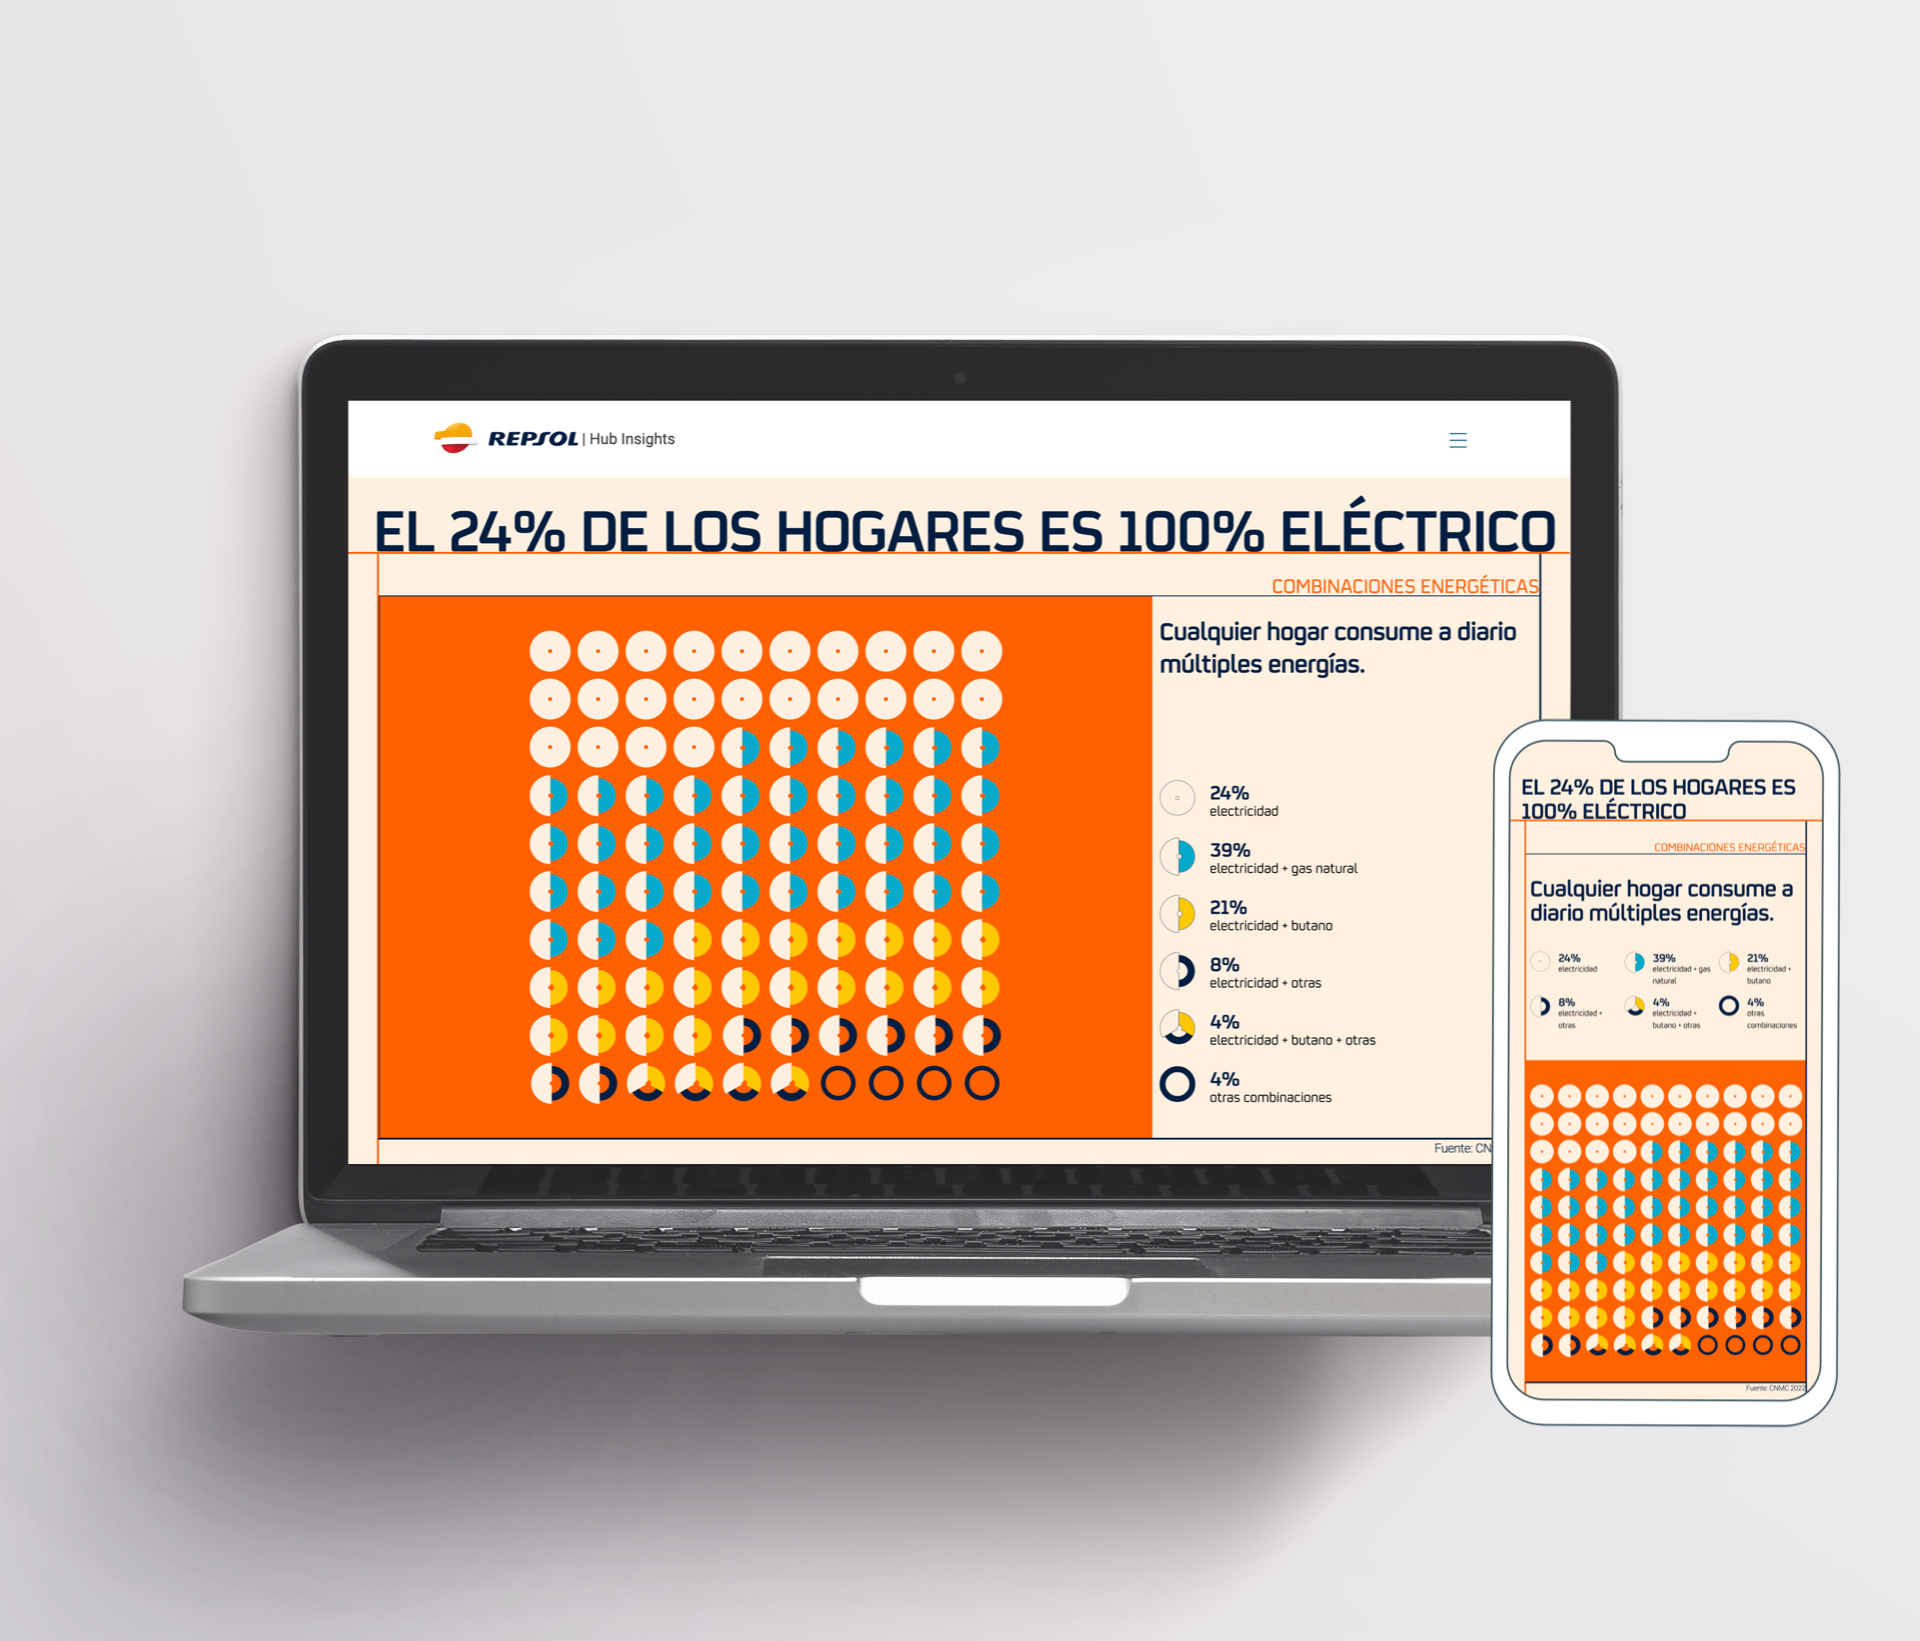
We told the story through data. Data transformed into visualizations that sparked curiosity, paired with a strategic narrative that delivered the message clearly and powerfully.
The result was an interactive report for internal use—visual and distinctive. A tool designed to encourage reflection about the future of the sector.
- Client
- Repsol
- Year
- Service
- Data Consultancy, Strategic Storytelling, Data Visualization
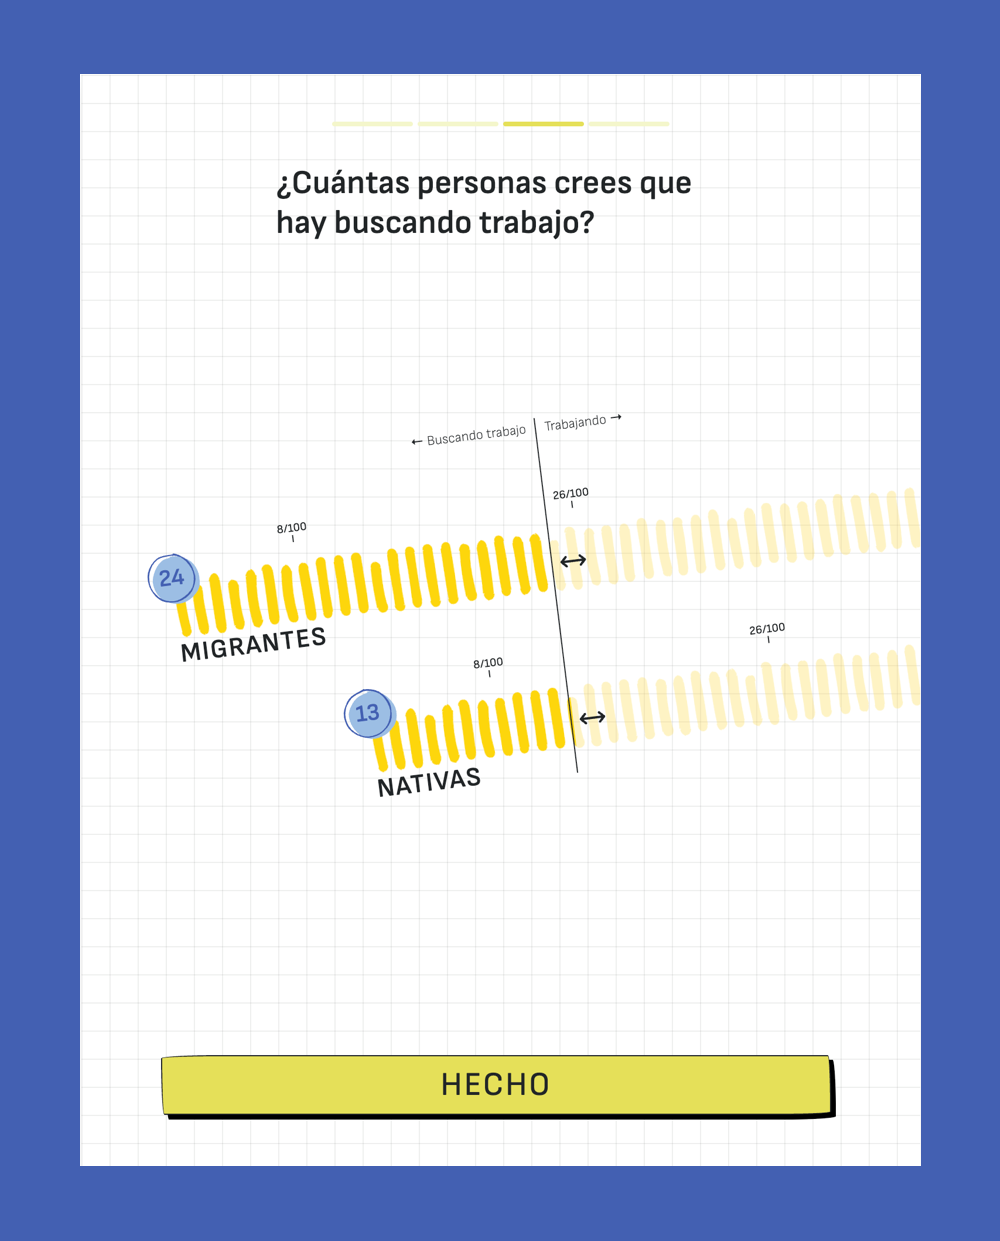
Custom visualizations
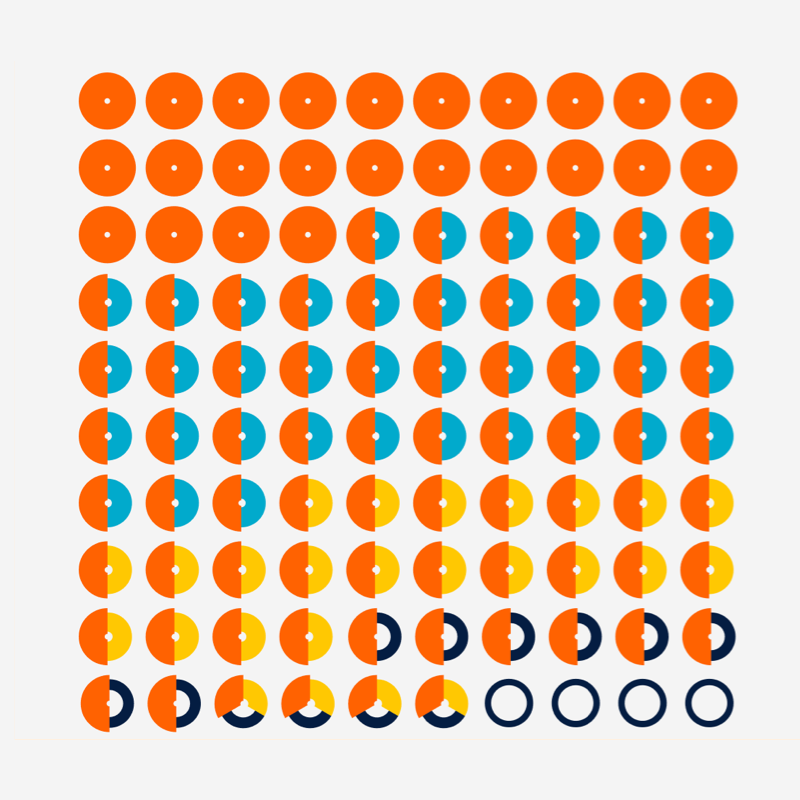
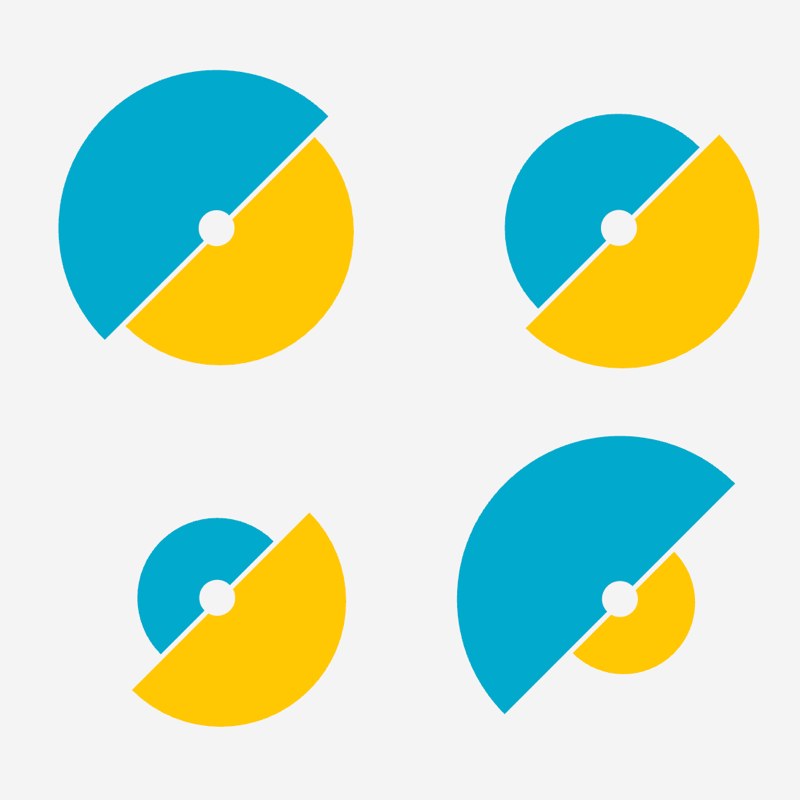
Data appeared throughout the report, but we didn't want it to feel like a simple list of numbers. So we designed unique visualizations, custom-made for each section.
This approach made the document feel fresh and engaging. It didn't just show information: it invited people to stop, explore, and keep reading.
Visualization stopped being a graphic resource and gained its own voice: different, engaging, impossible to ignore.

A structured, powerful narrative
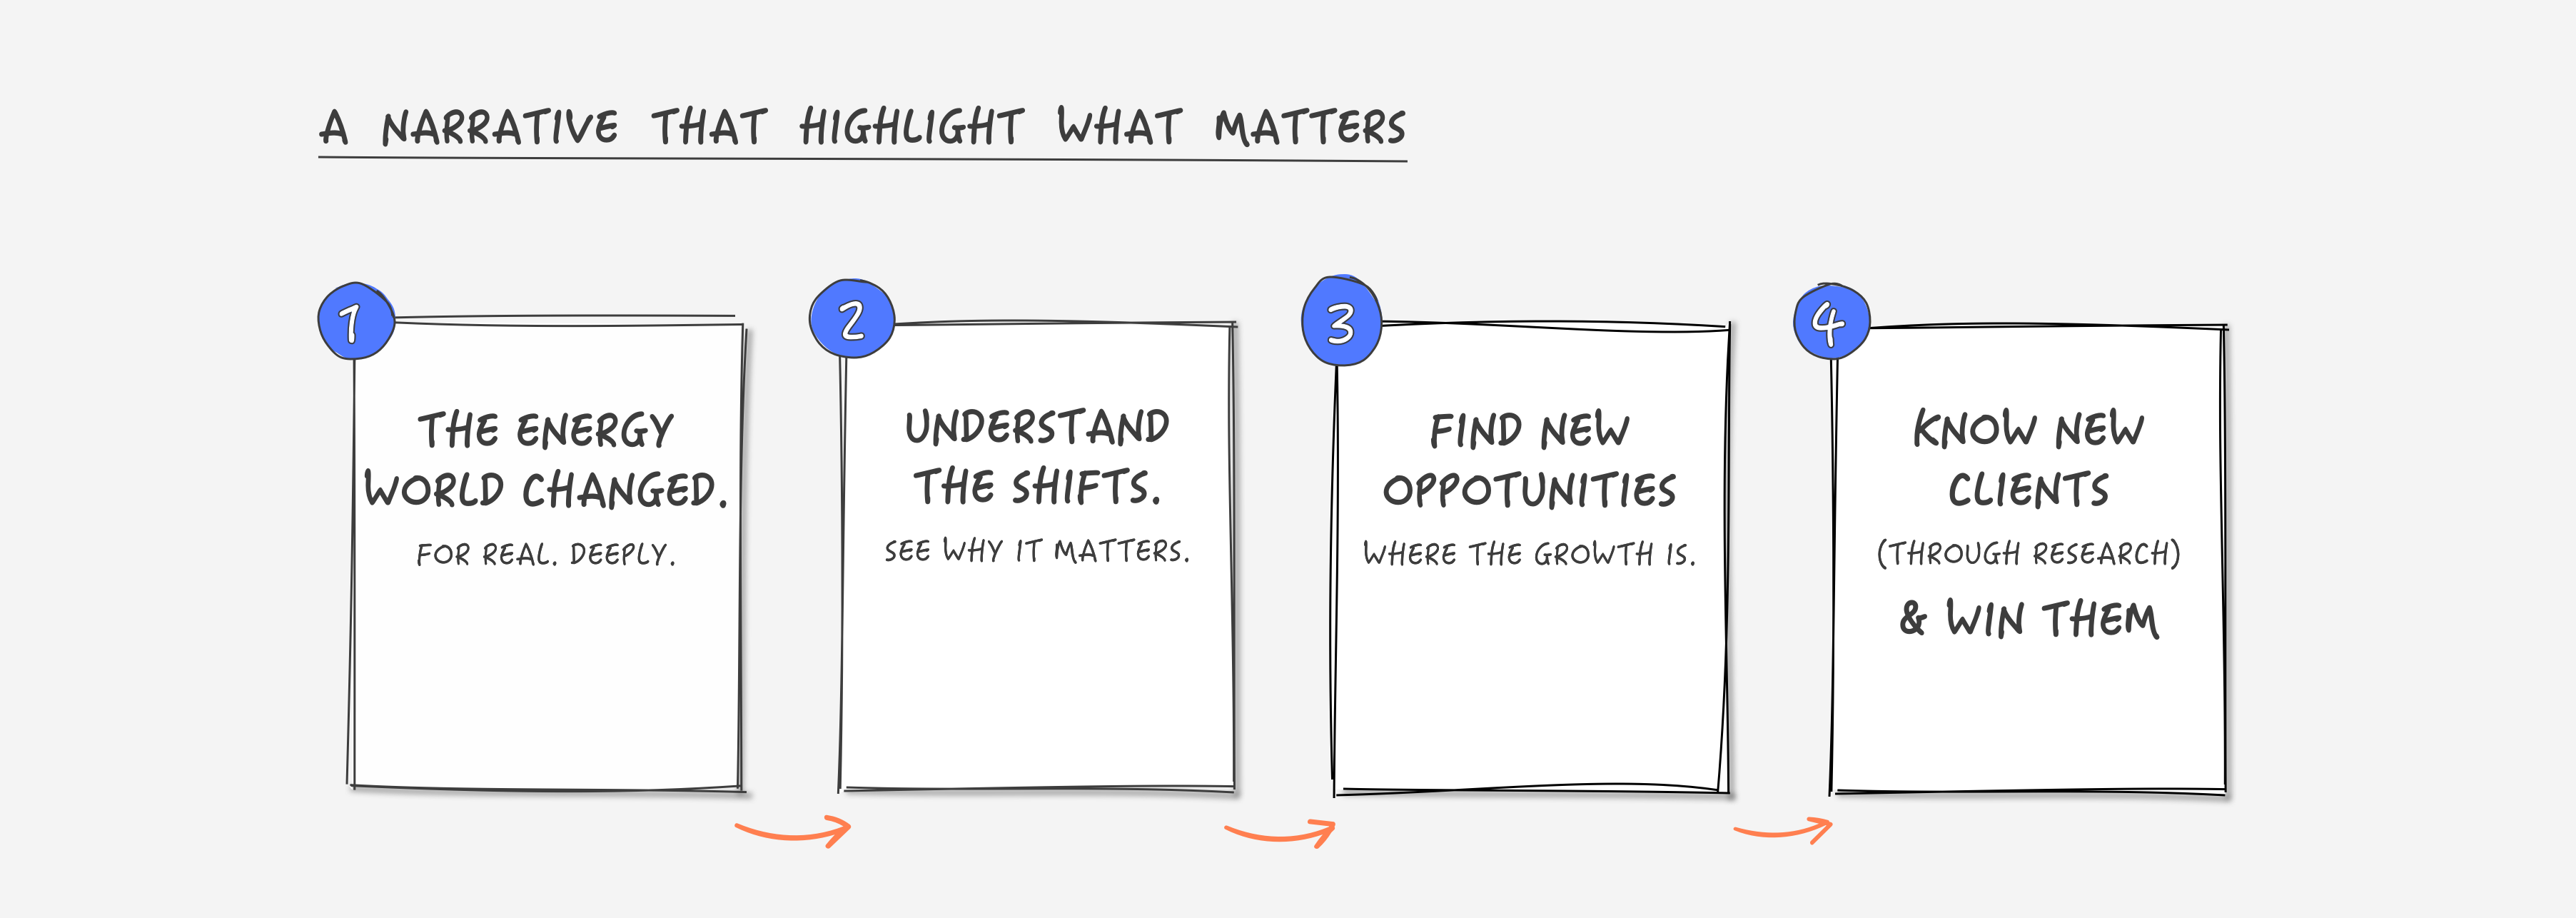
To shape that story, we worked alongside our partners at Materia Prima. We gathered findings from previous research, organized internal data, and combined it with official sources. From there, we built a strategic narrative that was clear and coherent.
The story was structured around five key areas for the company: current household needs, energy consumption patter`ns, competitive landscape, contracting, and customer retention.
Data backed every transformation, while visualizations brought it to life with clarity and impact. All written in direct language that reinforced the visual narrative and made the message easy to grasp and reflect on.
Easy to share, easy to consume
A key aspect: this report wasn't presented, it was distributed. The priority was for anyone to access it anytime, from any device, without barriers.
Whether someone opened it on their phone during their commute or checked it on their computer at the office, they always found a smooth, friendly, and inspiring experience.
The document was designed to adapt to different rhythms and situations, with a multi-device design that made it easy to read and truly accessible.
What we delivered
A complete interactive report: research synthesis and data analysis, information architecture and narrative development, custom data visualizations, UX/UI design, responsive web development, and internal stakeholder testing.
What we did
- Data Visualization
- Data Consultancy
- Strategic Storytelling
- Development (D3.js)