Case Study -
Turning data into conversation: community participation in MadridWhat makes people stop participating in their neighborhood? The local association wanted to understand why. To find out, we designed something different: a physical data visualization intervention that brought the conversation directly to the streets.
Working with Materia Prima, we created a methodology that bridges data and dialogue. The goal wasn't just collecting answers—it was sparking reflection, surfacing different perspectives, and generating conversation that leads to change.
- Client
- Federación Asociaciónes Vecinales Madrid
- Year
- Service
- Data Consultancy, Strategic Storytelling, Data Visualization
Meeting people where they are
The challenge was reaching people who don't attend meetings or fill out surveys—residents disconnected from the association.
Organizations often face this same problem. They deliver information in reports or presentations and wait for the audience to react. That rarely happens.
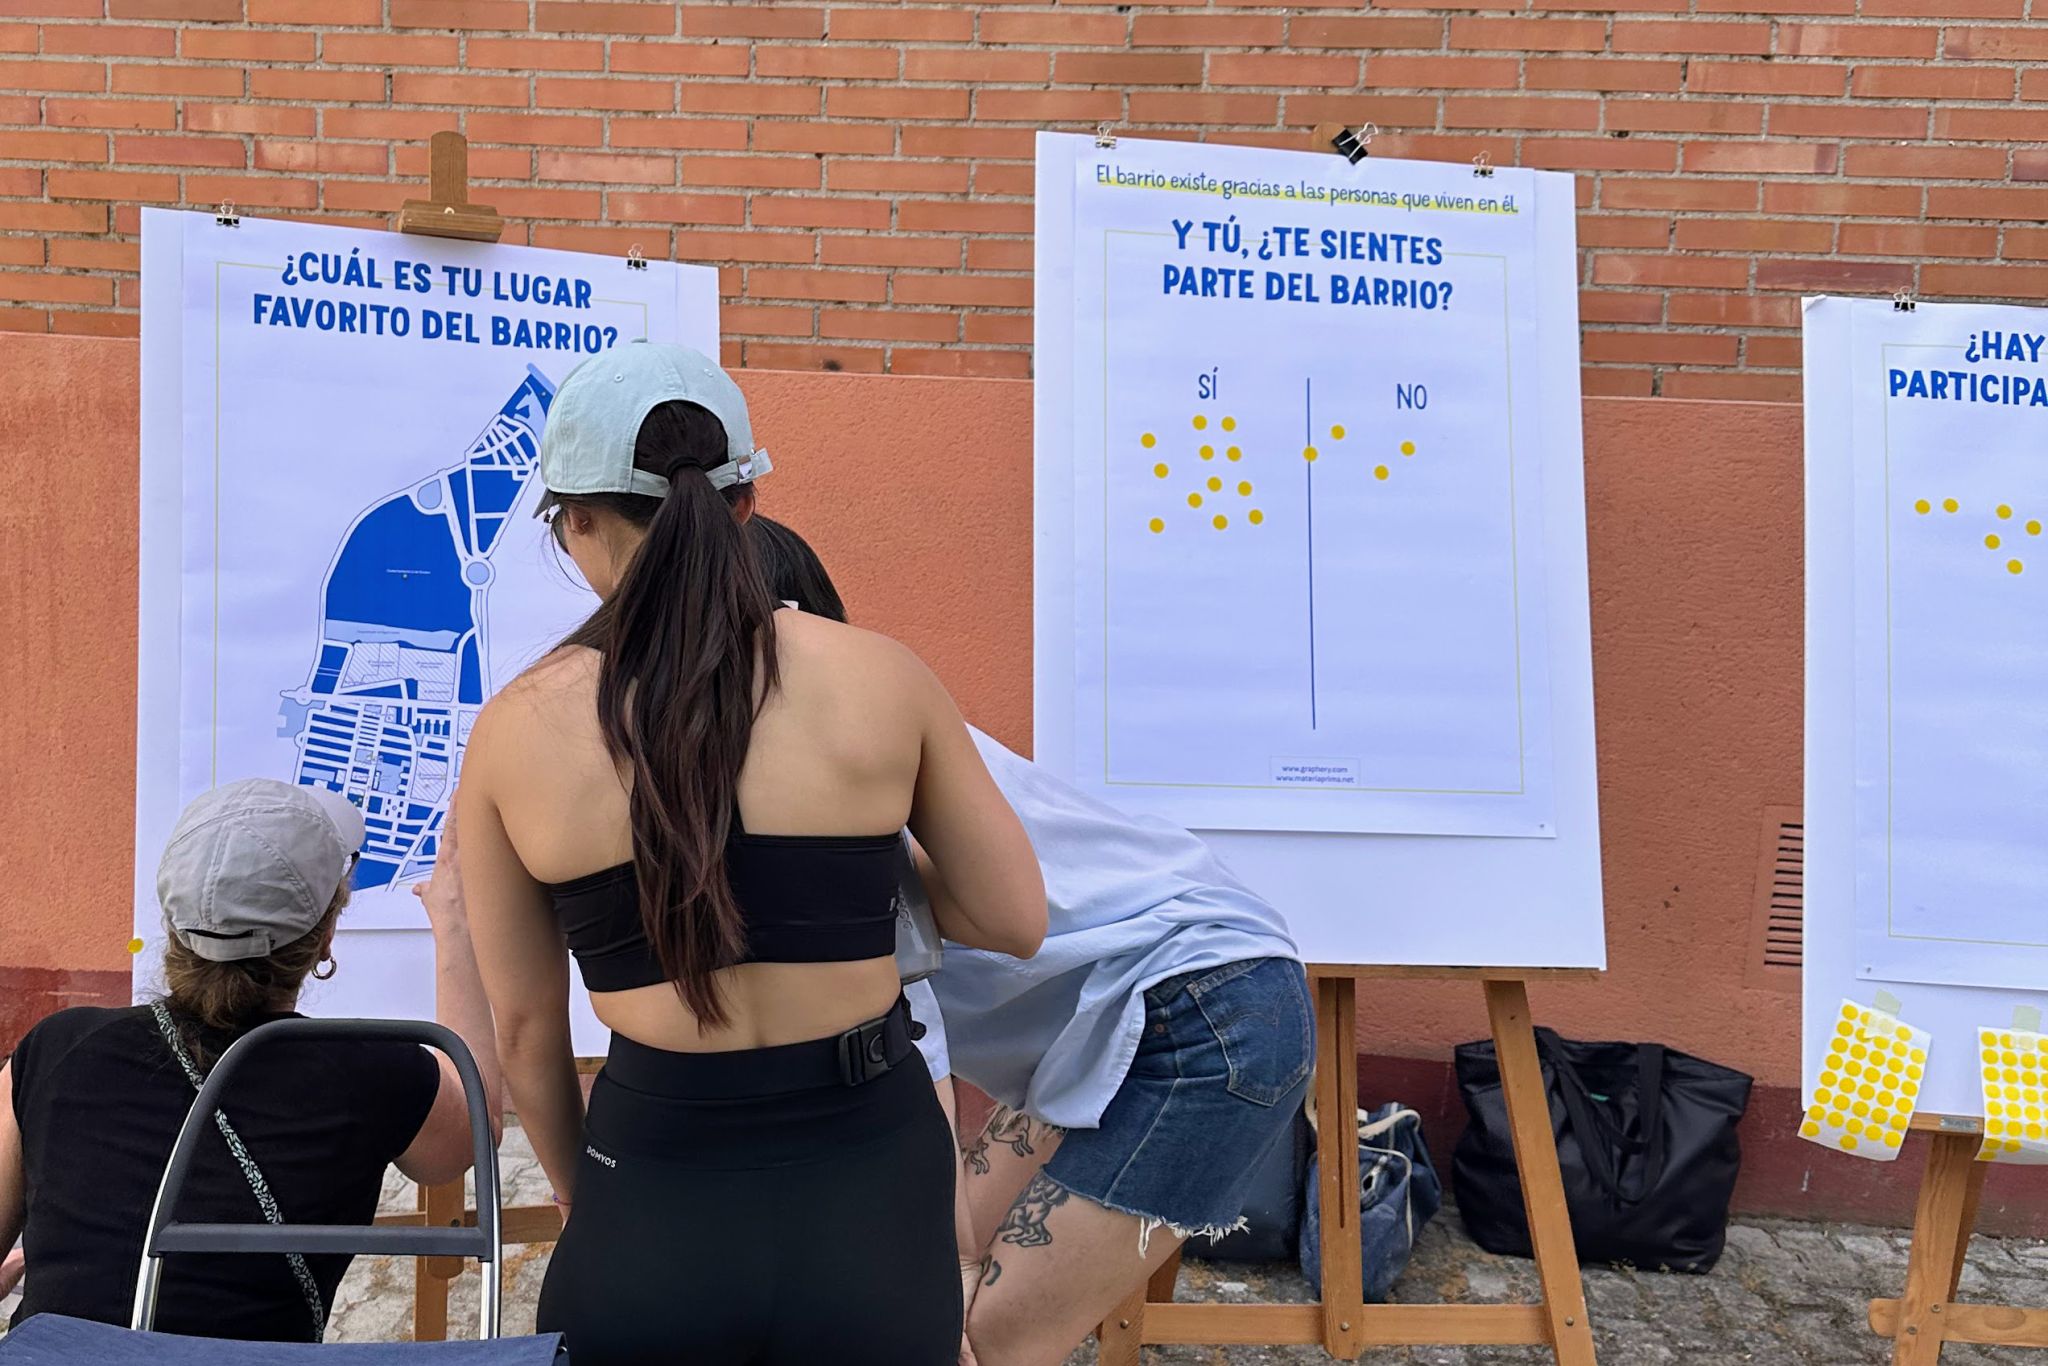
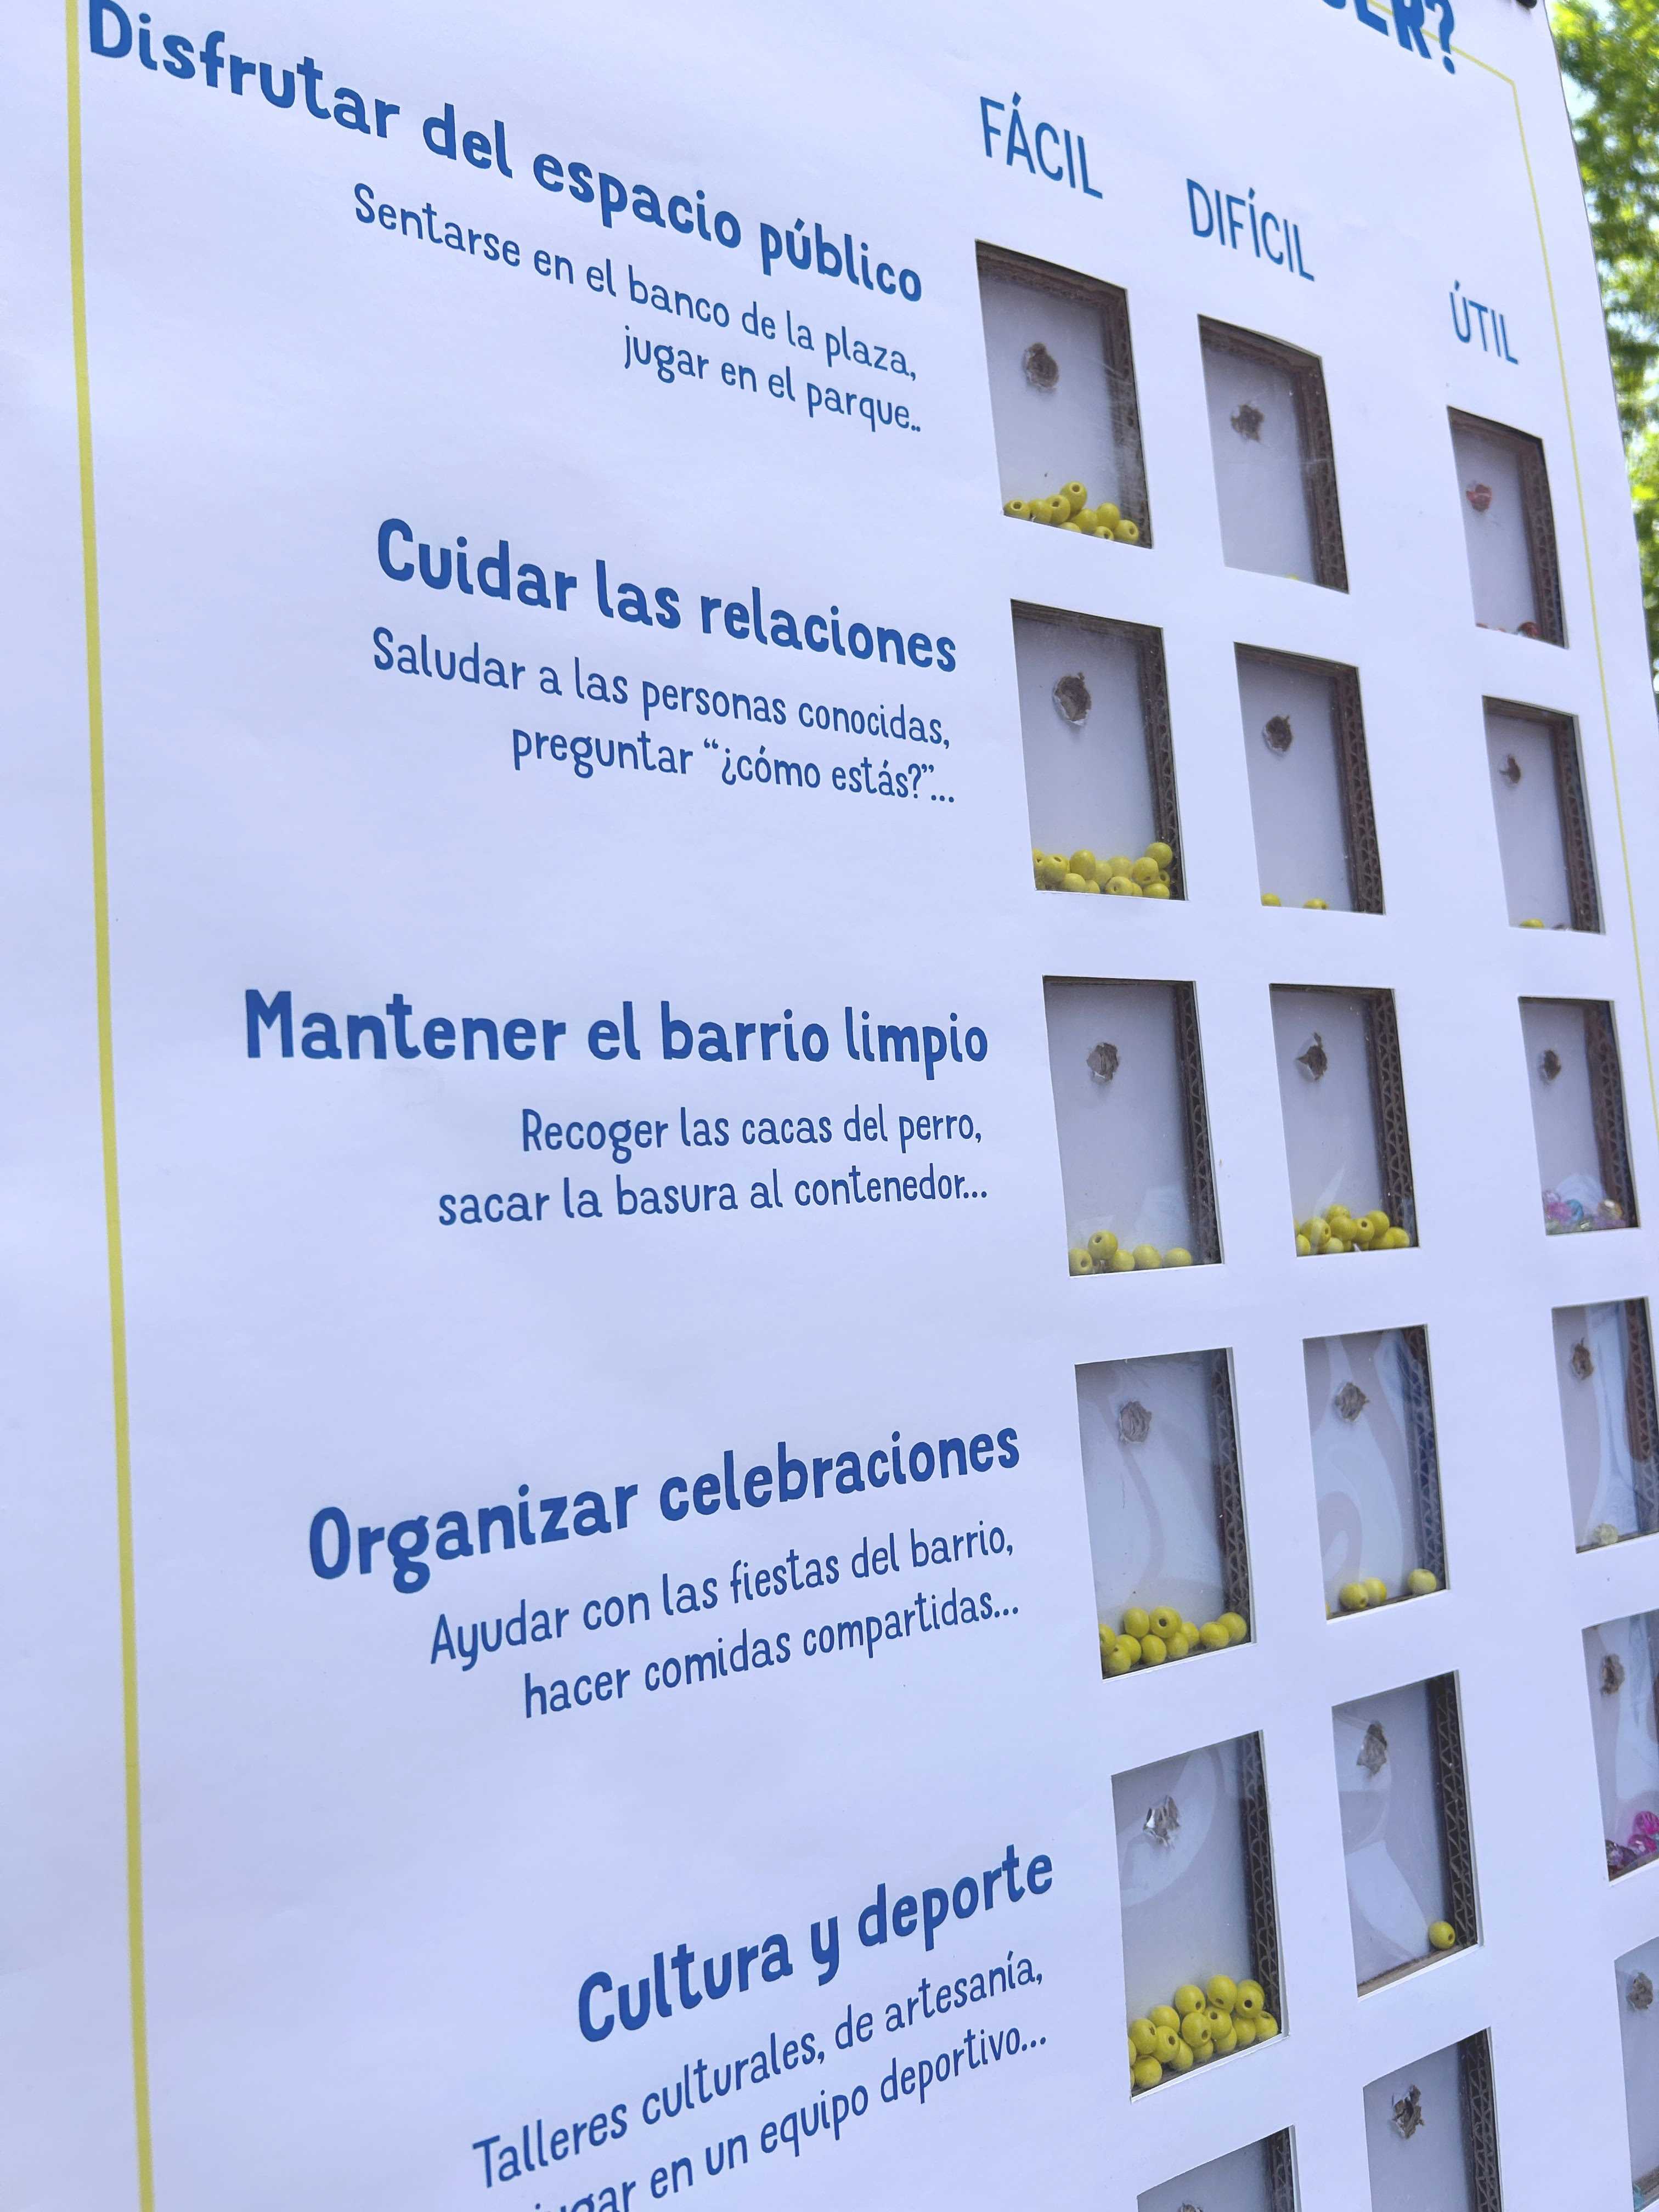
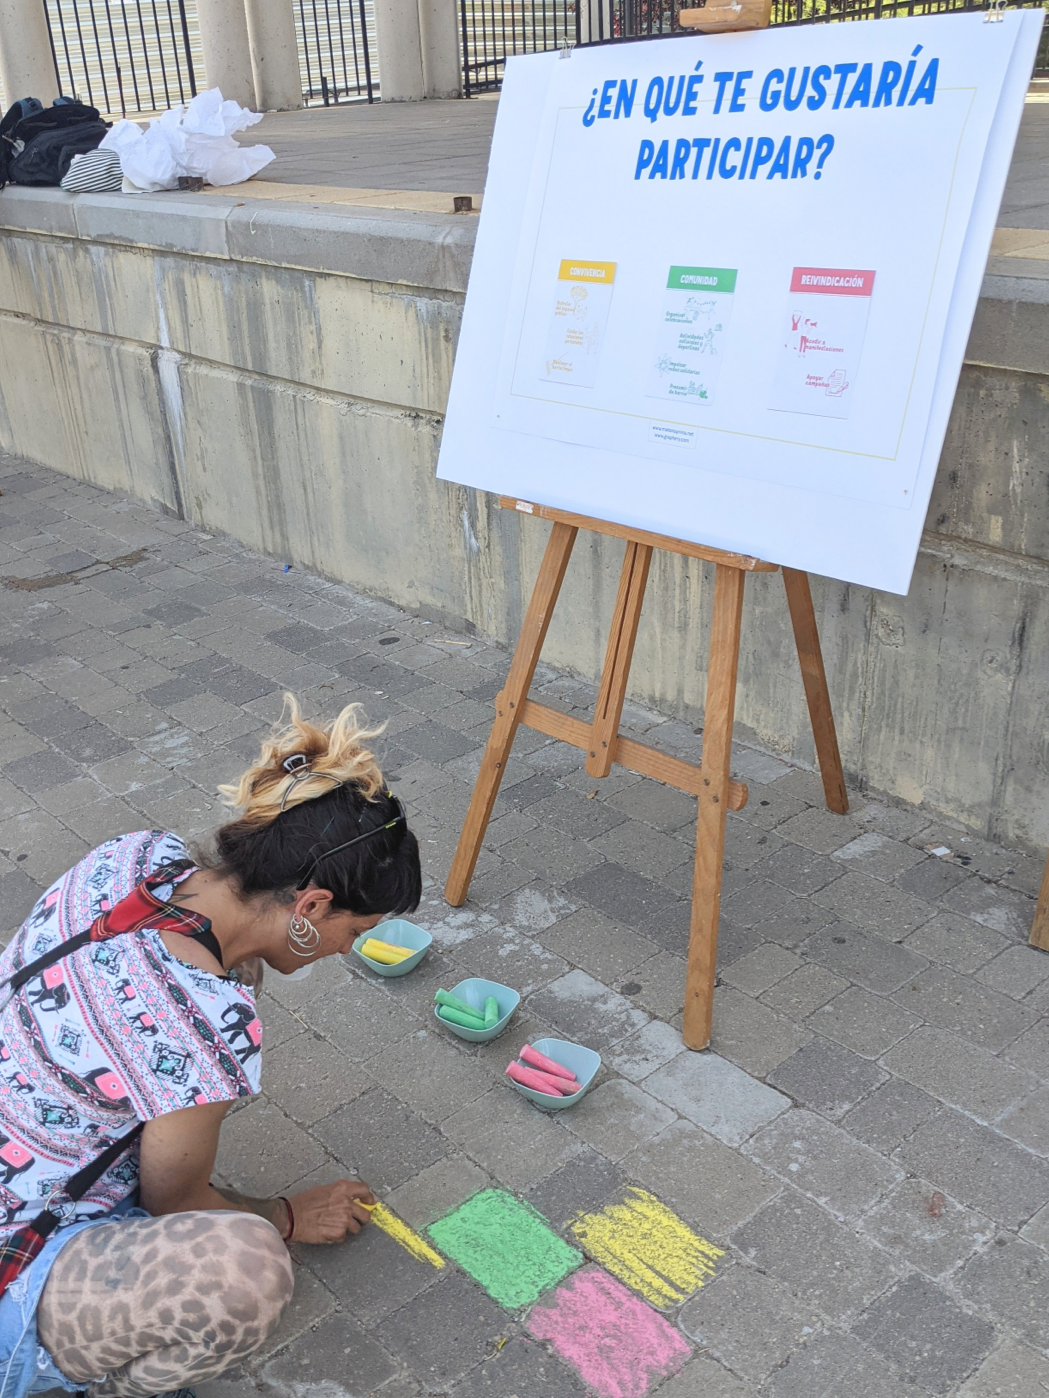
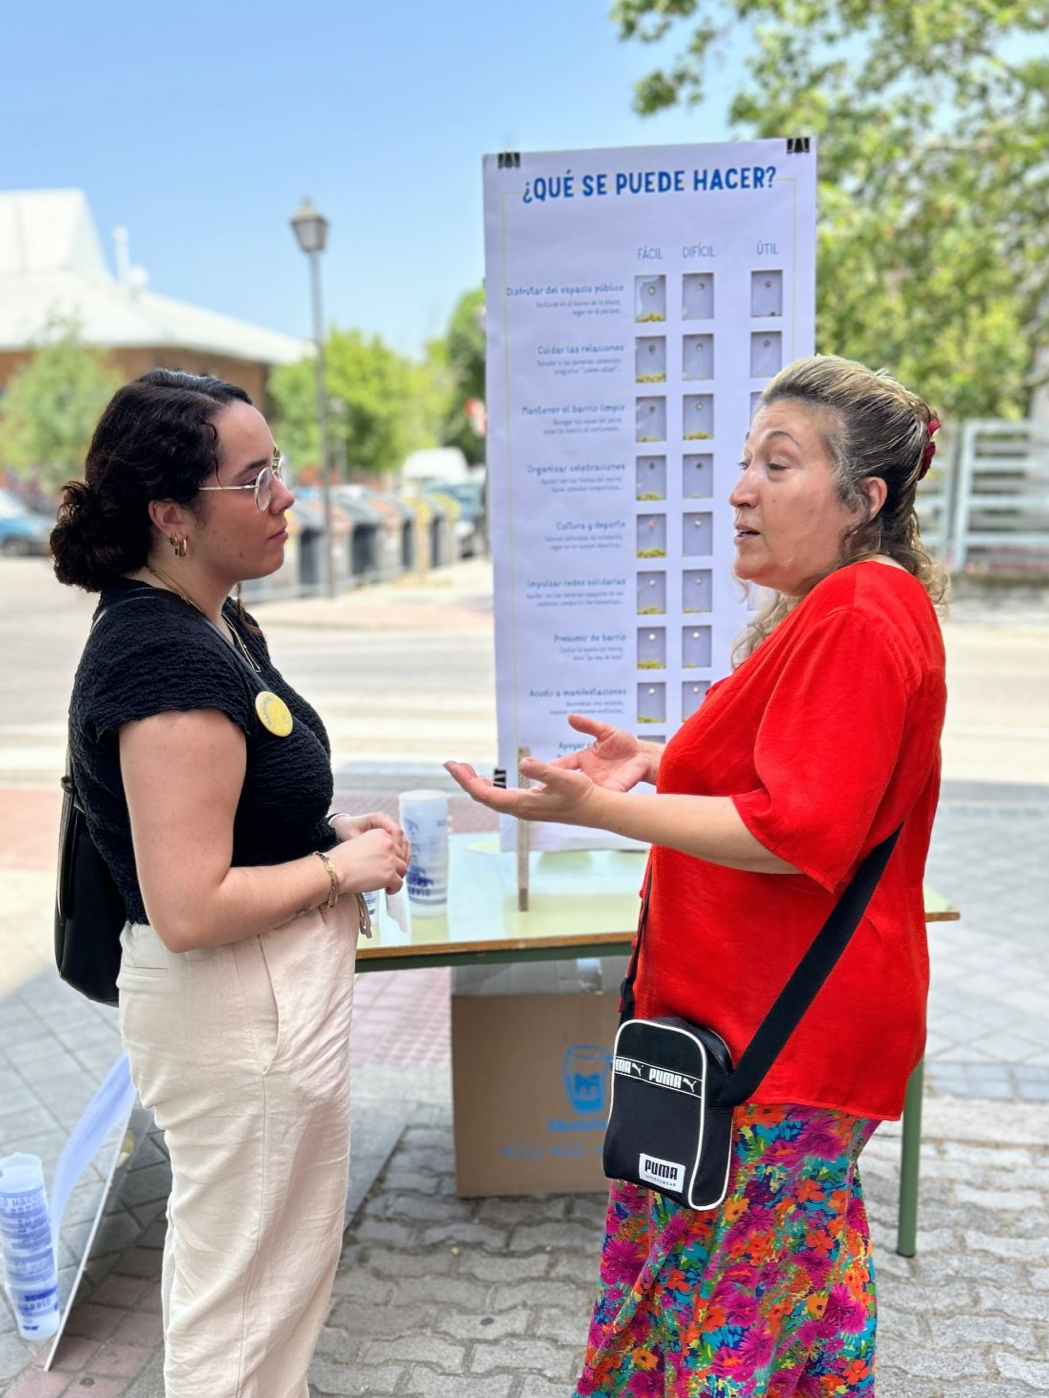
We flipped the script. Bring the conversation to the people and make participation immediate. We designed a physical installation for the neighborhood festival—large maps, colorful stickers, simple questions. It looked playful, almost like a game. That was intentional.
Start easy, go deep
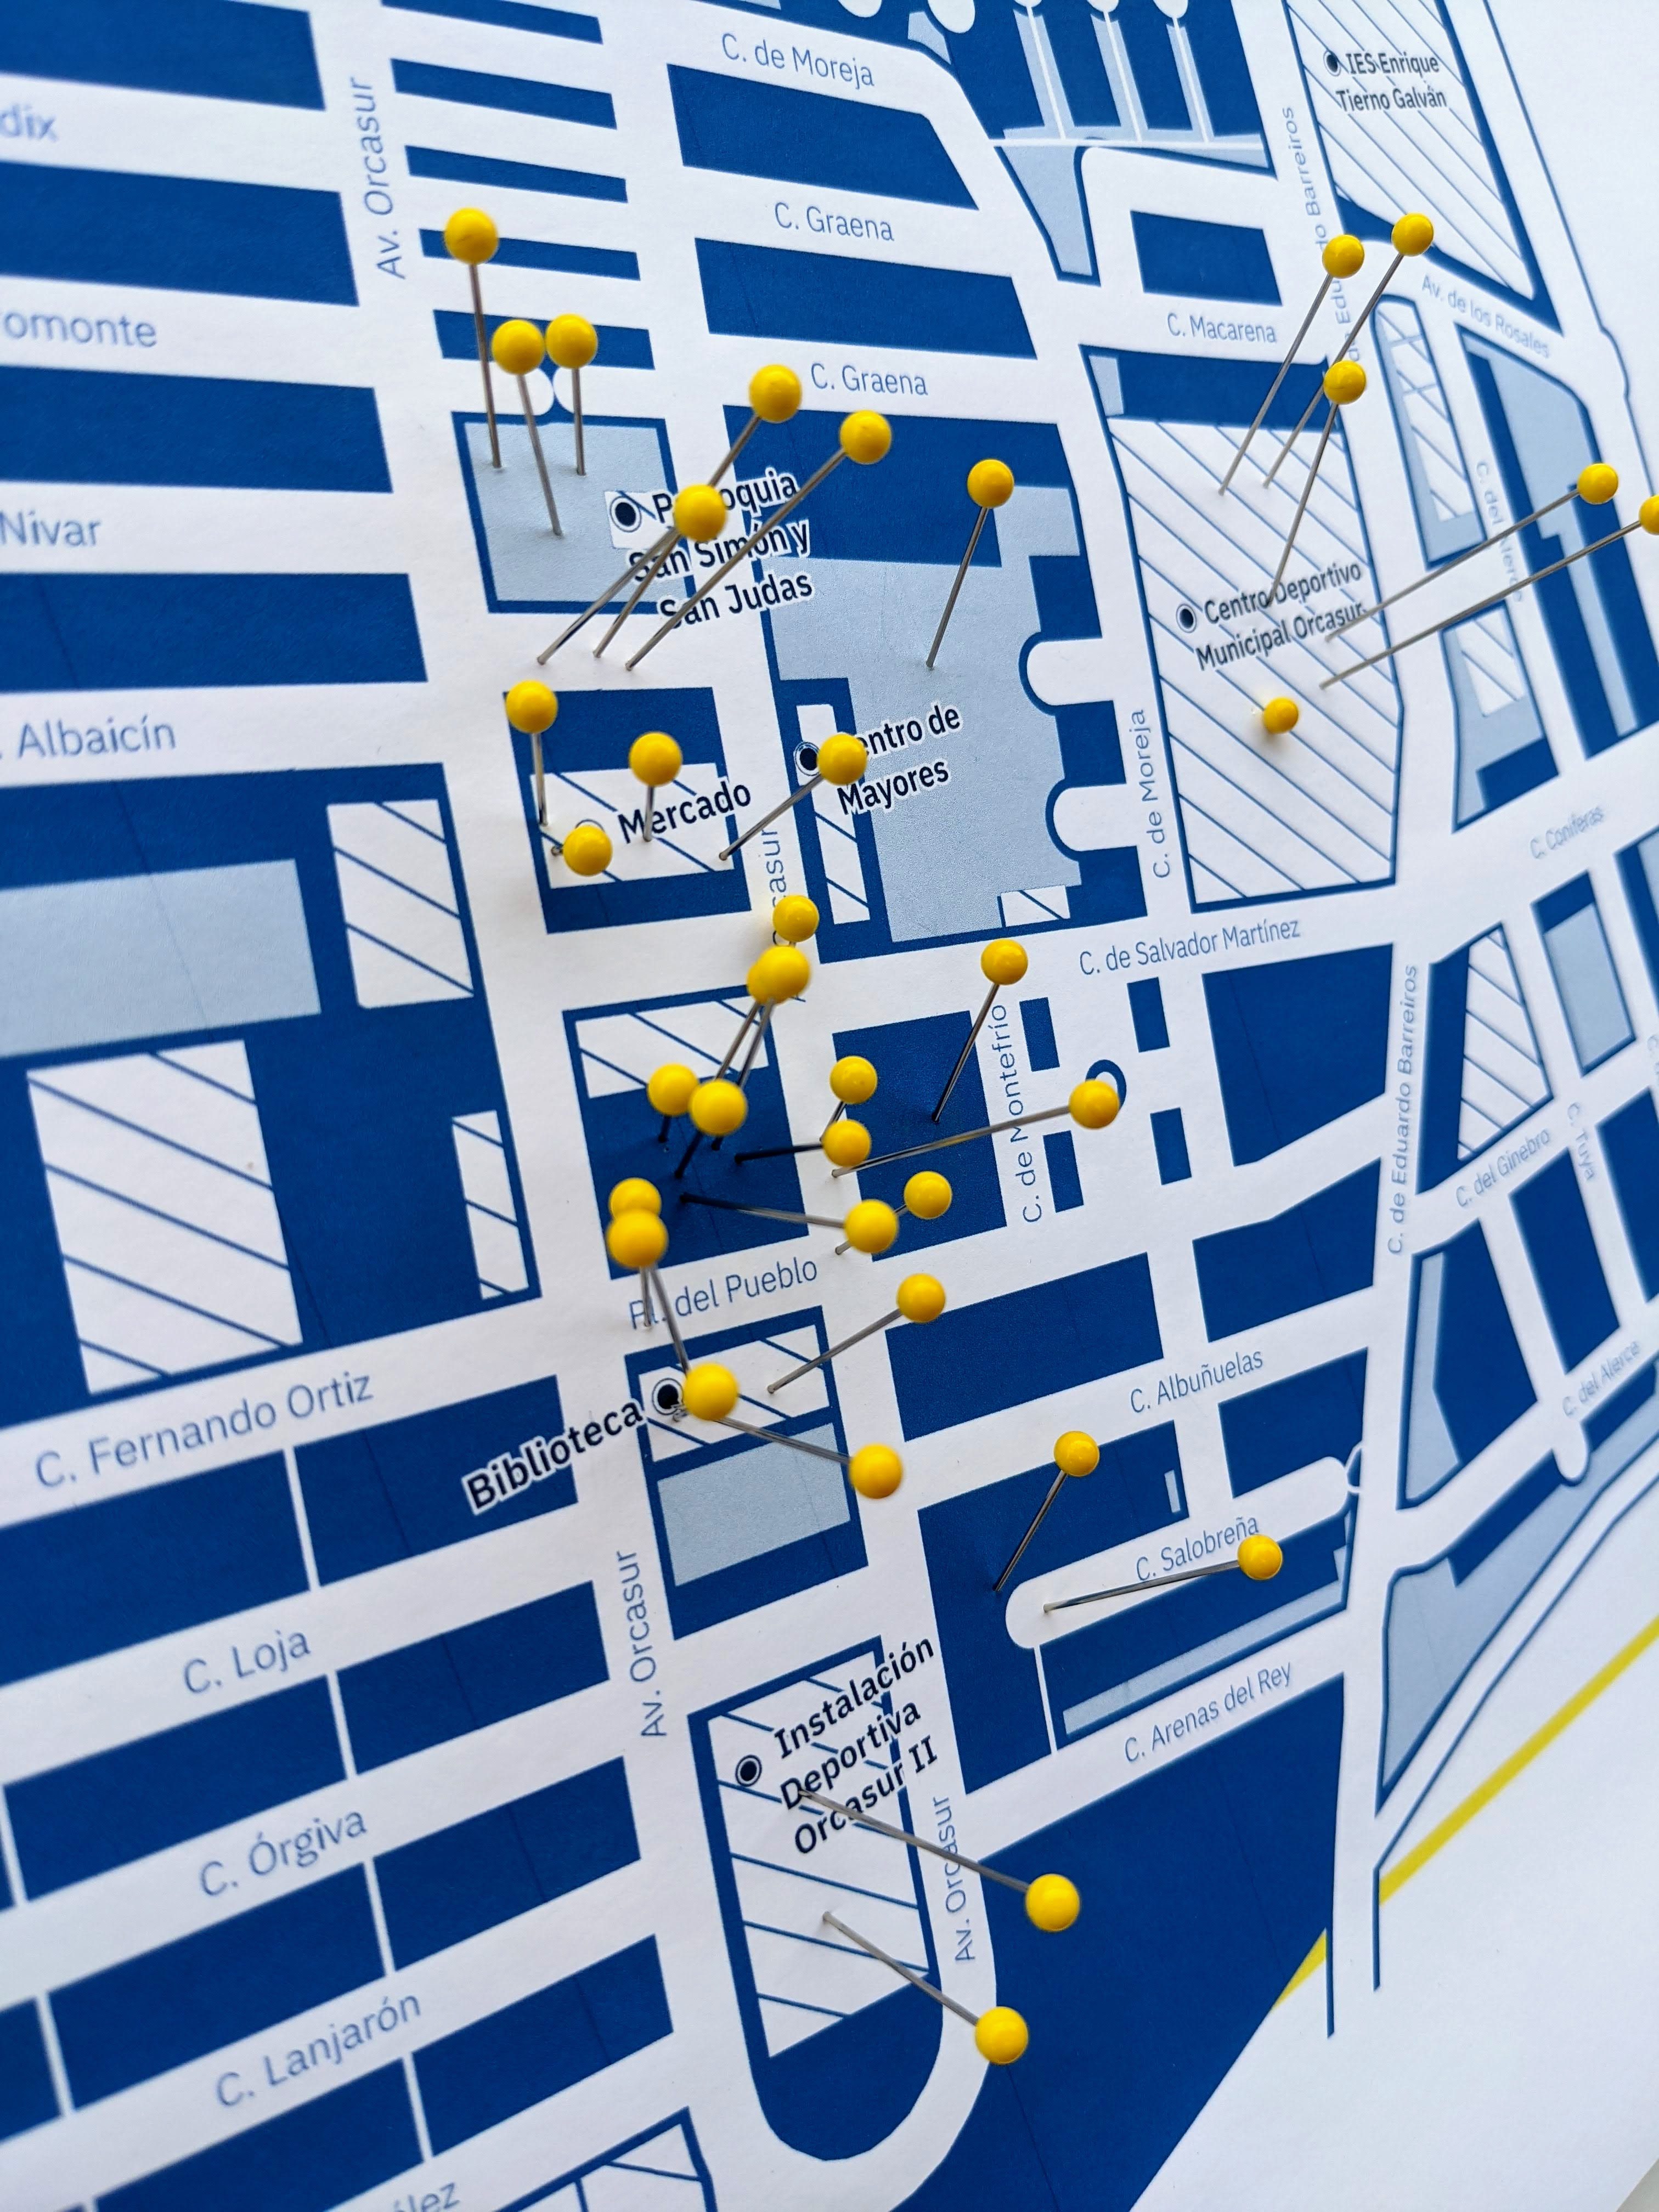
We started with something easy: "What's your favorite place in the neighborhood?" People placed pins on a map. Fun, visual, no barriers.
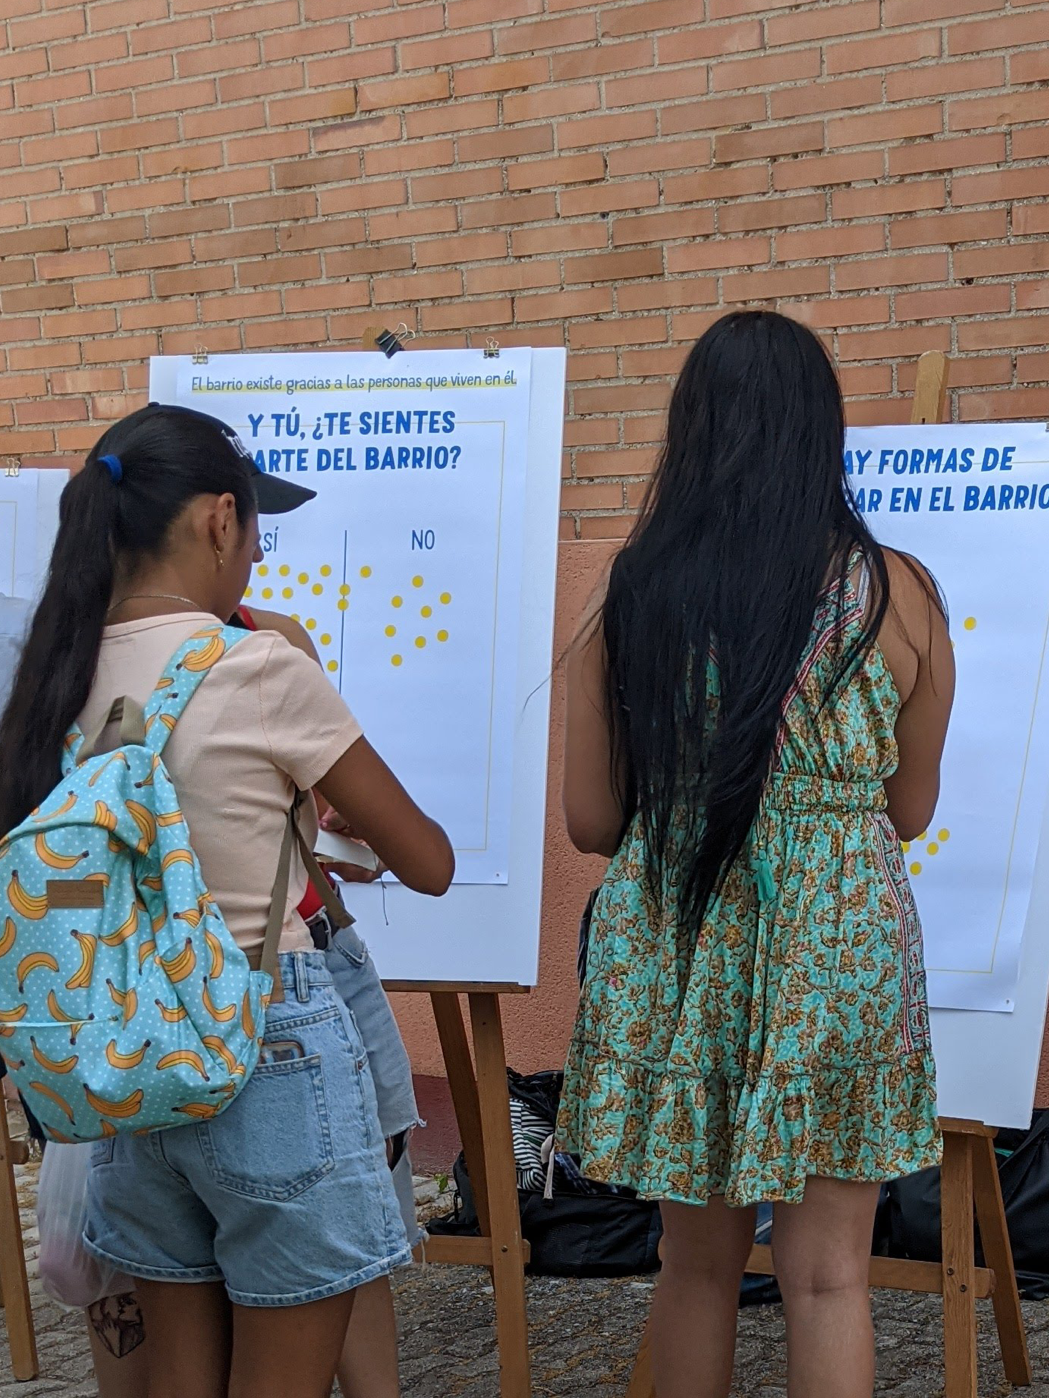
But here's what happened: once people were engaged with something simple, we could go deeper. Do you feel part of the neighborhood? Are there ways to participate here? What does participation even mean to you?
Questions that look simple but open space for real reflection. The playful format removed intimidation. People explored complex concepts like community belonging and civic participation without realizing they were having a serious conversation.
That's the shift: start easy, go deep.
How physical data visualization changes the game
Participation. The playful setup works as a hook. We saw consistent engagement from a diverse range of residents—not just the usual suspects who always show up.
Reflection. Placing a physical sticker forces a moment of pause. Participants didn't just answer; they questioned their own assumptions. "You're asking how I participate, but what does participation actually mean to me?"
Debate. The visualization becomes a conversation starter. Seeing clusters of pins on a map in real time sparked spontaneous discussions: Why do these places matter? What does it mean to belong here? The data isn't just numbers—it's something to talk about.
We also captured the nuances behind the answers: motivations, doubts, and the different ways people understand participation.
From conversation to insight
After the intervention, we analyzed the data and delivered a report with revealing insights. The findings showed different understandings of participation, identified gaps where associations could play a role, and surfaced bridges between new forms of engagement and traditional organizing.
The methodology works because it meets people where they are—no formalism, just accessible questions and deep listening.
What we delivered
A complete community engagement intervention: methodology design and research, question flow and conversation strategy, physical data visualization materials, on-site facilitation and data collection, qualitative and quantitative analysis, and a final report with actionable insights.
What we did
- Methodology design & research
- Intervention strategy
- Physical data visualization
- Data analysis & reporting